
Chainlink price has been forming a bearish setup as whale demand for the token has declined over the past couple of weeks. If the setup is confirmed, it could likely mean more downside for the token ahead.
Summary
- Chainlink price has been in a downtrend since August this year.
- The altcoin could face more intense selling pressure now that whale buying has stalled.
- Multiple bearish patterns have formed on LINK charts.
According to data from crypto.news, Chainlink (LINK) has dropped 4.5% in the past 24 hours and 16.6% from its monthly high. Trading at $12.38 at press time, the losses extend to 54% from its highest point this year when zooming out the charts.
Chainlink price would likely continue to extend its downtrend over the coming weeks as it is close to confirming a bearish pattern on the charts. This comes amid a significant drop in demand from whales.
As per data from Nansen, whales holding LINK increased from 1.77 million to 1.91 million around the first two weeks of December, but have since dropped to 1.87 million. Declining demand from these large-pocketed investors is typically seen as a warning sign by retail investors and tends to drive attention away from the token.
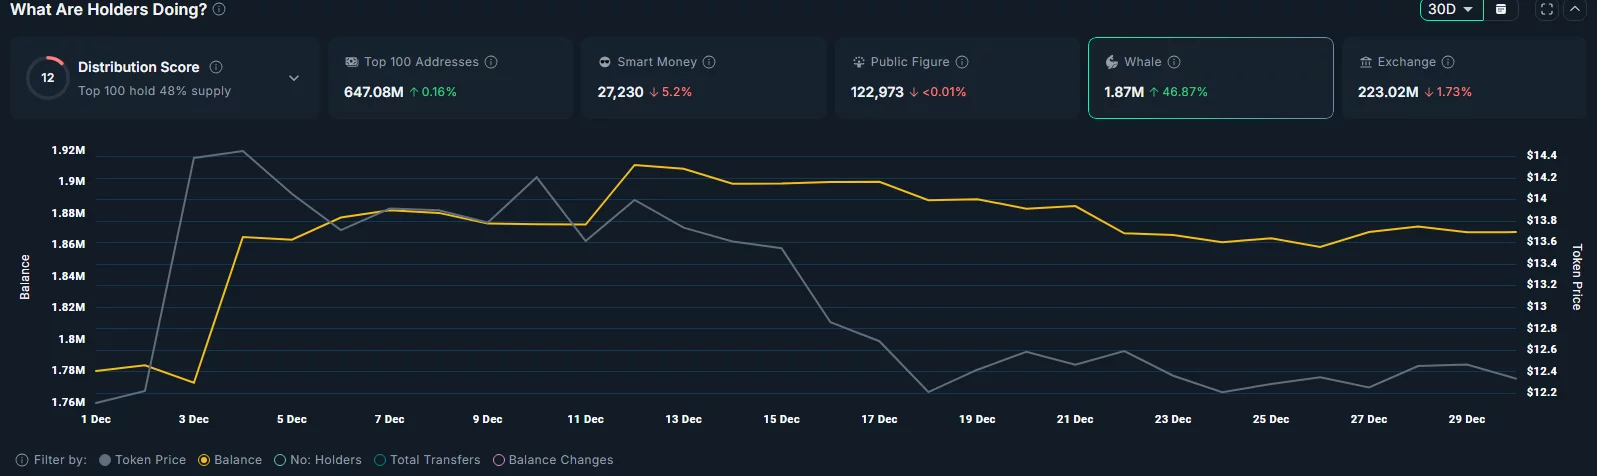
On-chain metrics have also been deteriorating, pointing to a broader slowdown in network activity.
Data from DeFiLlama shows that the total value locked in DeFi protocols built on the Chainlink network has dropped from $1.13 billion recorded in late August to $530 million at press time. Additional data shows that weekly fees have dropped nearly 50% since September.
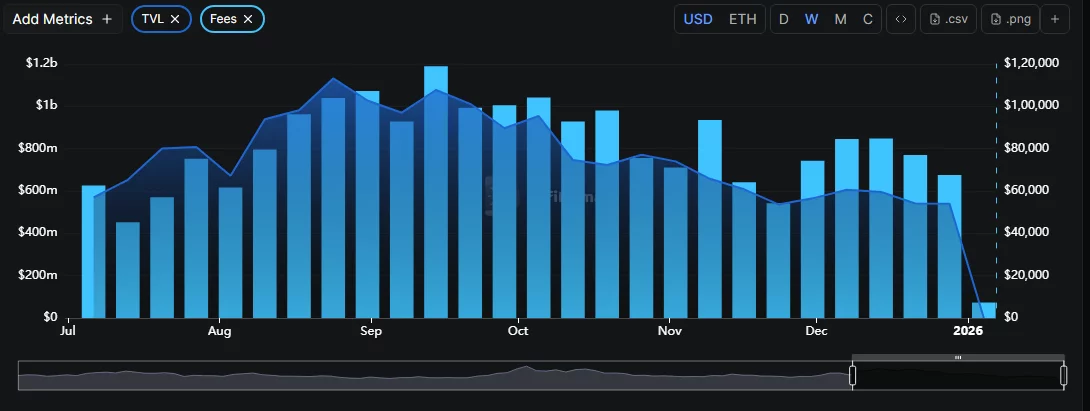
When taken together, they suggest that overall interest and utility in the Chainlink ecosystem have softened, potentially limiting upside for the token in the short term.
On the daily chart, Chainlink price has been forming a descending triangle pattern with a descending trendline and a horizontal trendline, which acts as support. Such a pattern is confirmed when the price breaks down from the lower horizontal trendline.
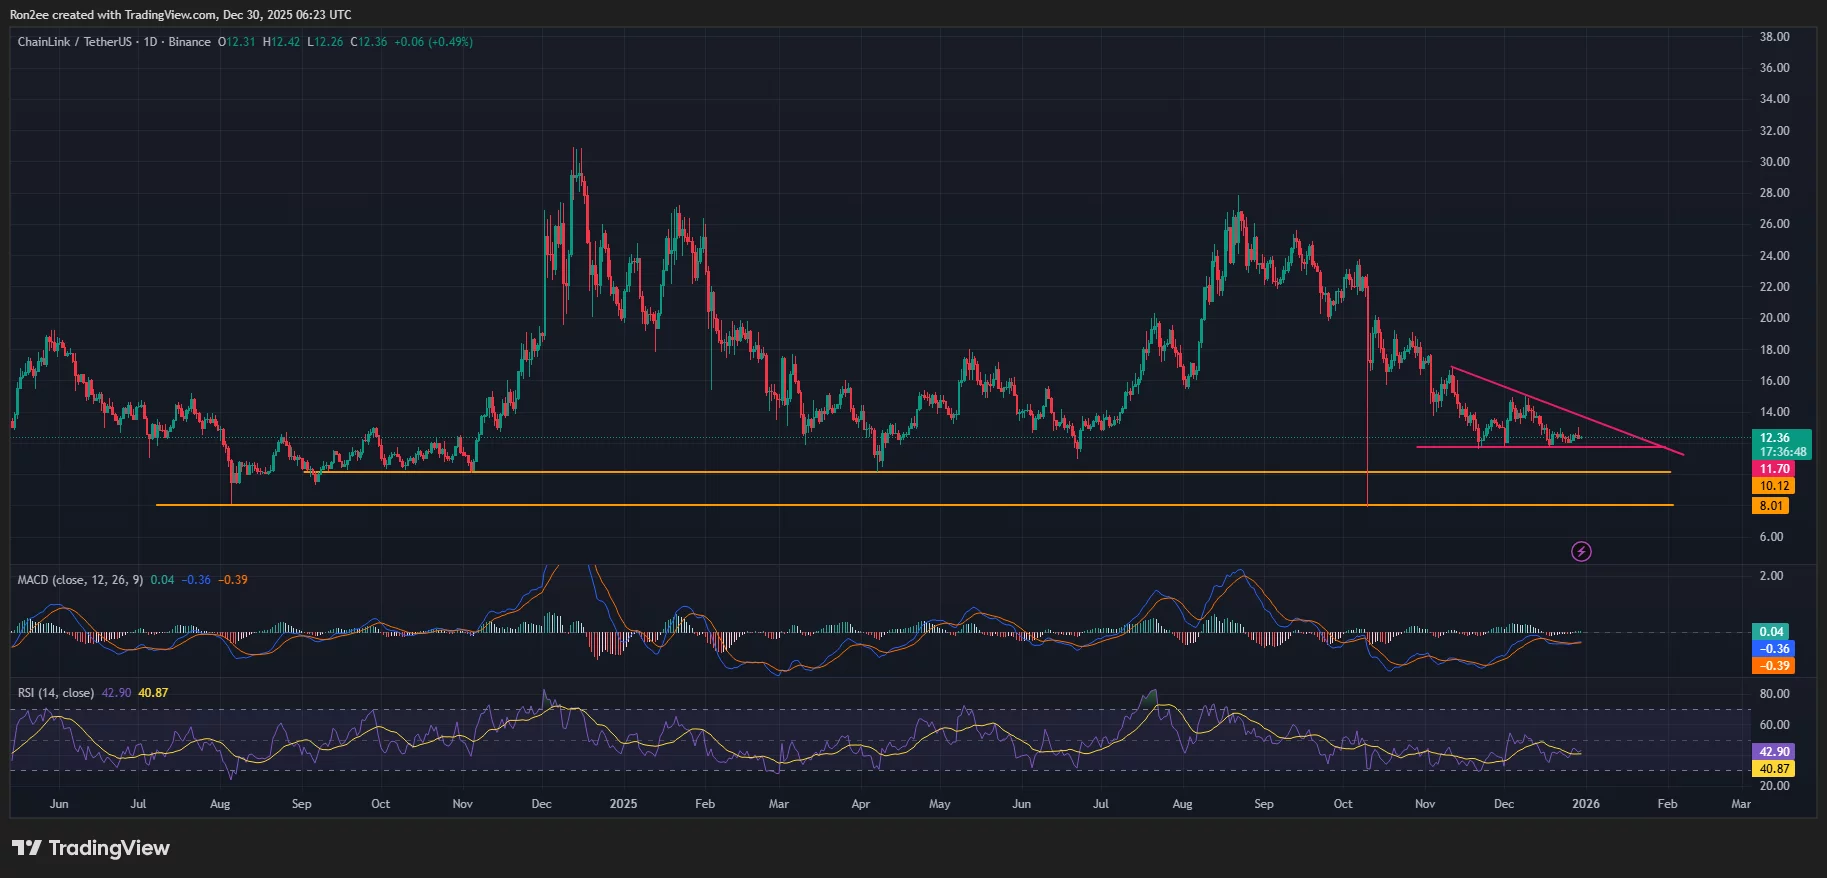
At press time, LINK price was hovering just 5% above the lower trendline. Historically, a confirmed breakdown from this pattern has consistently preceded increased selling pressure and further downside movement.
Momentum indicators, specifically the MACD and RSI, further corroborate the prevailing bearish sentiment. With the MACD lines positioned below the zero mark and the RSI trending downward at 42, the data suggests that sellers maintain sufficient control to drive prices lower before reaching oversold conditions.
As previously reported by crypto.news, Chainlink price has also been eyeing a breakdown below a multi-year double top pattern, which could further compound the downside risk.
Hence, there is a chance that Chainlink price could crash to its August 2024 low of $8 if it fails to hold the $10.1 support level, which has served as a strong floor since mid-2024.
Disclosure: This article does not represent investment advice. The content and materials featured on this page are for educational purposes only.
